Jul 20, 2022
Hierarchical Clustering in ML: Key Concepts Explained
Clustering is one of the most fundamental tasks in unsupervised machine learning. Among the different clustering techniques, hierarchical clustering in machine learning stands out for its intuitive structure and flexibility. Whether you're analyzing customer behavior, genetic data, or document similarity, hierarchical clustering can help you group similar data points without needing to specify the number of clusters in advance.
This guide covers everything you need to know about hierarchical clustering—from the basics and working mechanism to its types, real-world use cases, advantages, limitations, and practical implementation.
What Is Hierarchical Clustering in Machine Learning?
Hierarchical clustering is a type of unsupervised learning that organizes similar items into clusters by measuring their distance or similarity. Unlike flat clustering methods (like K- means), it builds a multilevel hierarchy of clusters in the form of a tree-like structure called a dendrogram.
This method is especially useful when you don’t know the optimal number of clusters beforehand or when you want a visual representation of how clusters relate to one another.
Types of Hierarchical Clustering
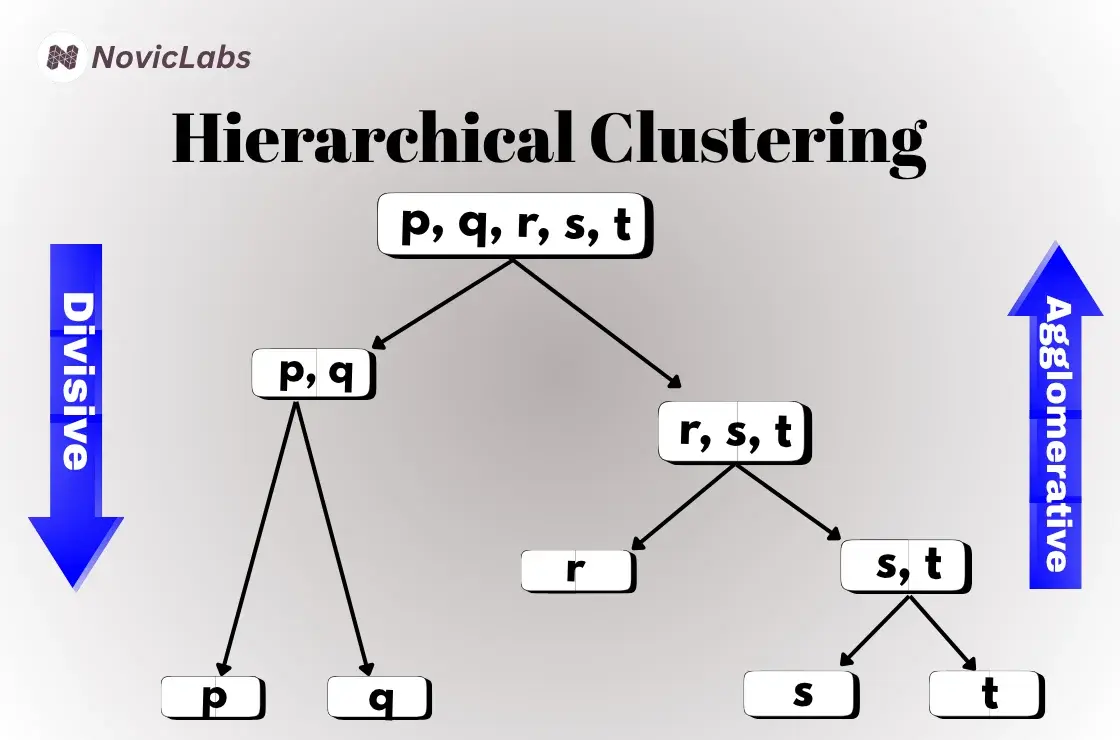
Hierarchical clustering in machine learning is divided into two main types:
Agglomerative Hierarchical Clustering (Bottom-Up Approach)
This is the most commonly used type. Each data point starts as its own cluster, and pairs of clusters are merged step-by-step based on similarity until one big cluster remains.
Steps:
Compute the distance matrix between all points.
Identify the closest pair of clusters and merge them.
Update the distance matrix.
Divisive Hierarchical Clustering (Top-Down Approach)
It starts with all points in a single cluster and recursively splits them into smaller clusters.
Steps:
Treat the whole dataset as one cluster.
Use a splitting method to divide it into two.
Continue recursively until each point is in its own cluster or meets the stopping criteria.
What Is a Dendrogram?
A dendrogram is a tree-structured diagram that illustrates how data points are grouped together or separated during the hierarchical clustering process.
Think of it like a family tree — it shows which points are similar, how they get grouped, and in what order they merge. The vertical lines represent the merging of clusters, while the height of each line indicates the level of similarity or dissimilarity between the combined clusters.
Simple Analogy
Imagine you have 5 friends:
Alice
Bob
Charlie
Dave
Eva
You want to group them based on how similar they are in terms of hobbies.
Let’s say:
Alice and Bob like the same things merged first.
Dave and Eva also have similar tastes they get grouped next.
Charlie is different joined later.
How to Decide the Number of Clusters?
You draw a horizontal line (like slicing a tree) through the dendrogram.
Where the line cuts through vertical lines determines how many clusters you get.
Example:
If your line cuts through 3 vertical branches, you have 3 clusters.
This is often called the elbow rule in dendrogram analysis—look for the largest vertical distance between merges and cut there for meaningful clusters.
Advantages of Hierarchical Clustering
No Need to Predefine Clusters
Unlike K-means, you don’t need to specify the number of clusters beforehand.
Visual Interpretability
Dendrograms provide an intuitive understanding of data grouping and relationships
Flexible Distance Metrics
Works with various distance and similarity measures.
Suitable for Small Datasets
Performs well with limited data where cluster relationships are more meaningful.
Real-World Applications
Hierarchical clustering is widely used in various industries and domains:
Bioinformatics: Clustering genes or DNA sequences based on similarity
Retail: Customer segmentation based on purchase history
Document Analysis: Grouping similar text documents or news articles
Psychology: Classifying behavior patterns in mental health research
Web Analytics: Grouping website users based on browsing patterns
Tips for Effective Hierarchical Clustering
Standardize your data before clustering to avoid bias from different scales.
Use Ward’s method for better compact clusters if your goal is interpretation.
Use the silhouette score or the elbow method to help choose the optimal number of clusters
Conclusion: Hierarchical Clustering in Machine Learning
To conclude, hierarchical clustering in machine learning offers a powerful and visually intuitive way to explore patterns in data, especially when you want to understand relationships without knowing the number of clusters in advance. While it’s best suited for smaller datasets due to computational complexity, it remains a foundational tool in the machine learning toolbox.
By understanding how it works and how to apply it correctly, you can uncover deep insights in your data and build better, smarter models that reflect the true structure of the information you’re analyzing.
STREAMLINE YOUR BUSINESS WITH AI?
Main
Resources
Developers
Company
Contact Us
+1 (999) 888-77-66
hello@noviclabs.com
Location
483920, Indonesia,
Lampung 22/2/5, Office 4
© 2023 Noviclabs All rights reserved.